PERFORMING FOREX TOOL V1 EXPLANATION
3.5 هزار بار بازدید -
3 سال پیش
-
Version mql4 :
Version mql4 :
https://www.mql5.com/en/market/produc...
Version mql5:
https://www.mql5.com/it/market/produc...
My email for contact: [email protected]
So guys.
My name is Davide and unfortunately I only speak Italian and that is why I am using a voice translation I ask you for some patience for this inconvenience.
In this video, I will give you a simple and clear explanation of the product you have just purchased.
After installing the file, Performig forex tool on your Metatrader 4.
I advise you to delete all the graph below so as not to have graphical interference which is sometimes normal when the graph is moving in the real market.
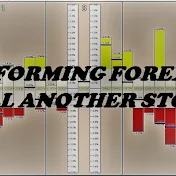
You will find this screen there.
Now what is there to know ?.
Performing forex tool consists of three quadrants.
In the first quadrant, there are the currency exchanges which are composed at the base or at the share with euro or dollar.
In the second quadrant there are the currency crosses which are not composed at the base or at the share with euro and dollar, but are a consequence of the shift in currency exchanges.
In the third quadrant there is only the exchange rate of Euro Dollar.
Being that Performing forex tool, it is a visual tool there are several colors that make you immediately guess what is happening.
When the colors are clear it means that the currencies are not yet ready for a possible boost.
On the other hand, when the colors are brighter it means that currencies are entering into a possible push reaction.
Remember that this is not a constant, as nothing in trading is.
So it's up to you to decide what to do.
As you can see above in the positive zone is the maximum that the currency pair has reached.
Then in the negative zone there is the minimum that the pair has reached.
This data will change based on the period we are looking at.
It can vary by day, week, month and year.
As you can see, there is also a blue line with the percentage change.
This line is very important for the observer.
Because it is the actual and actual percentage change that the currency pair is making.
It is only when the blue line is positive or negative in the brightest color that we should consider a possible trade.
If it were in the lighter colored area it would not be the right time to trade the pair.
Of course, the decision is up to you, and the risks that come with it.
Well guys I hope I was clear and see you in the next video.
My email for contact: [email protected]
Link product:
https://www.mql5.com/en/market/produc...
~-~~-~~~-~~-~
Please watch: "Performing Forex Tool : un outil exceptionnel pour le FOREX 23 05 2022"
Performing Forex Tool : un outil exce...
~-~~-~~~-~~-~
https://www.mql5.com/en/market/produc...
Version mql5:
https://www.mql5.com/it/market/produc...
My email for contact: [email protected]
So guys.
My name is Davide and unfortunately I only speak Italian and that is why I am using a voice translation I ask you for some patience for this inconvenience.
In this video, I will give you a simple and clear explanation of the product you have just purchased.
After installing the file, Performig forex tool on your Metatrader 4.
I advise you to delete all the graph below so as not to have graphical interference which is sometimes normal when the graph is moving in the real market.
You will find this screen there.
Now what is there to know ?.
Performing forex tool consists of three quadrants.
In the first quadrant, there are the currency exchanges which are composed at the base or at the share with euro or dollar.
In the second quadrant there are the currency crosses which are not composed at the base or at the share with euro and dollar, but are a consequence of the shift in currency exchanges.
In the third quadrant there is only the exchange rate of Euro Dollar.
Being that Performing forex tool, it is a visual tool there are several colors that make you immediately guess what is happening.
When the colors are clear it means that the currencies are not yet ready for a possible boost.
On the other hand, when the colors are brighter it means that currencies are entering into a possible push reaction.
Remember that this is not a constant, as nothing in trading is.
So it's up to you to decide what to do.
As you can see above in the positive zone is the maximum that the currency pair has reached.
Then in the negative zone there is the minimum that the pair has reached.
This data will change based on the period we are looking at.
It can vary by day, week, month and year.
As you can see, there is also a blue line with the percentage change.
This line is very important for the observer.
Because it is the actual and actual percentage change that the currency pair is making.
It is only when the blue line is positive or negative in the brightest color that we should consider a possible trade.
If it were in the lighter colored area it would not be the right time to trade the pair.
Of course, the decision is up to you, and the risks that come with it.
Well guys I hope I was clear and see you in the next video.
My email for contact: [email protected]
Link product:
https://www.mql5.com/en/market/produc...
Please watch: "Performing Forex Tool : un outil exceptionnel pour le FOREX 23 05 2022"
Performing Forex Tool : un outil exce...
3 سال پیش
در تاریخ 1400/08/22 منتشر شده
است.
3,572
بـار بازدید شده