gauge chart in Excel 📈 #gauges #chart #data
166 بار بازدید -
7 ماه پیش
-
gauge chart in Excel 📈
gauge chart in Excel 📈#gauges #chart #data
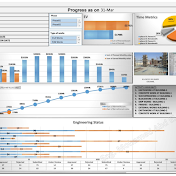
Gauge charts give you a way to quickly see how well a given metric is performing against a target goal. The components of a gauge chart are: A center bar showing the actual value of the metric you are graphing. An optional vertical line showing a target value. An optional comparison value.
#gauges #chart #data
7 ماه پیش
در تاریخ 1402/09/28 منتشر شده
است.
166
بـار بازدید شده